PLoS One. 2013; 8(2): e54170.
Characterization of patients During the period October 2005-December 2011, 85 patients were enrolled into this retrospective study. Histologic subtypes of each NSCLC sample were evaluated based on World Health Organization (WHO) criteria [21]. Adenocarcinoma was the most common histologic subtype (63 patients, 74.1%). Cancer staging was performed according to the UICC–AJCC-TNM system (version 7, 2009) [22]. Advanced disease (stages IIIb – IV) was identified in 61.2% of enrolled patients. Patient data are summarized in Table 1. Forty-five patients were confirmed to be EGFR mutant type (group-M), including 25 patients with exon 19 deletions (group-M/E19) and 20 patients with exon 21 mutations (group-M/E21).
PLoS One. 2013; 8(2): e54170.
Heterogeneity of EGFR mutation detected by DHPLC and ARMS Tumor microdissection yielded 2,699 foci, including 1,238 foci from wild-type EGFR (group-W) and 1,431 group-M cases. The overall mutant frequency in group-M was 80.6% by DHPLC (1,154/1,431) and 87.1% (1,247/1,431) by ARMS. Mutant frequencies varied widely throughout individual tumors, ranging between 5%–100% by DHPLC and 1%–100% by ARMS. Group-M samples were subdivided by mutation content as follows: 1) pure EGFR mutation (100%) or no mutational heterogeneity was detected in 21 cases by DHPLC (12 group-M/E19, 9 group-M/E21) and in 31 cases by ARMS (20 group-M/E19, 11 group-M/E21); 2) moderate mutant content (≥50%) or moderate-level heterogeneity was detected in 16 cases by DHPLC (10 group-M/E19, 6 group-M/E21) and in 9 cases by ARMS (2 group-M/E19, 7 group-M/E21); and 3) low mutant content or high-level heterogeneity (<50%) were detected in 8 cases by DHPLC (3 group-M/E19 and 5 group-M/E21) and in 5 cases by ARMS (3 group-M/E19 and 2 group-M/E21). Among the 40 group-W cases, 4 cases displayed low mutant frequencies ranging from 5.0% to 8.0% when microdissected tumor foci were analyzed by DHPLC. Three of these cases carried an EGFR exon 19 mutation, and one case carried an EGFR exon 21 mutation. ARMS confirmed these 4 cases and identified 6 additional cases showing very low mutant frequencies ranging from 1.0% to 5.0%. By combining the group-M cases carrying both wild- and mutant-type EGFR cells and the group-W cases containing mutant cells at low frequency, 32.9% (28/85) and 28.2% (24/85) of samples were identified to carry intratumoral EGFR mutational heterogeneity by DHPLC and ARMS, respectively. Difference of intratumoral EGFR mutational heterogeneity identified by two methods was not statistical significance (P = 0.031, McNemar's test) (Figure 1).
PLoS One. 2013; 8(2): e54170.
Semiquantitative analysis of exon 19 mutation by DHPLC We also measured semiquantitatively the EGFR mutant abundance by calculating the M/W peak height ratio from the DHPLC graph. We limited this analysis to the exon 19 deletion because the corresponding M and W peaks do not overlap under undenatured conditions (50°C) (Figure 2). The median M/W ratios of exon 19 were 2.43 (range, 0.40–18.15) among group-M samples and 0.12 (range, 0.06–0.22) among group-W samples (P = 0.005). Under partly denatured conditions (62.2°C), the M and W peaks corresponding to the exon 21 substitution overlapped, precluding any determination of their relative heights.
PLoS One. 2013; 8(2): e54170.
EGFR copy number FISH analysis was conducted on 85 tumor samples to measure EGFR copy numbers. Thirty-one cases (36.5%) were considered FISH-positive. The association of EGFR mutational heterogeneity as detected by ARMS with EGFR copy number is described below. Among the 31 patients with 100% EGFR-mutated cells (no heterogeneity), 71.0% (22/31) were classified as FISH-positive (high polysomy or gene amplification). By contrast, the low EGFR-mutated group exhibited approximately 13.3% FISH-positivity (2/15, including 10 low-frequency mutant cases in group-W and 5 low-frequency mutant cases in group-M), and the moderate EGFR-mutated group displayed approximately 22.2% (2/9) FISH positivity (P<0.05; Figure 3 and and4)4) which were similar to that detected in 30 patients with wild-type EGFR from whom microdissection foci were analyzed using ARMS (5/30, 16.7%, P = 0.75).
PLoS One. 2013; 8(2): e54170.
Heterogeneity by histological type and stage Adenocarcinoma was the most common histological pattern identified in this study (74.1% of subjects); this was expected in a predominantly surgical series. The positivity of EGFR mutation in adenocarcinoma, as confirmed by microdissection analysis, was 91.8%. The M/W ratio was 2.57 (range, 0.13–18.15). In comparison, the EGFR mutation frequency was lower among other histological patterns (70.9%), and only 3 cases carried the EGFR19 mutation with M/W ratio 1.53. Based on the UICC-AJCC-TNM tumor staging system, 50 tumors were classified as stage IIIa and IIIb (locally advanced) and 35 were classified as stage IV (advanced). No significant differences in the mutation positive rate and abundances were observed between locally advanced and advanced stages NSCLC (rate, 87.7% vs. 86.3%, P = 0.875; M/W ratio, 2.12 vs. 2.86, P = 0.662).
PLoS One. 2013; 8(2): e54170.
Impact of EGFR mutational heterogeneity on response to EGFR-TKIs Among 85 cases, 26 patients received EGFR-TKIs as first-line or multi-line therapies. 9 patients exhibited a partial response (PR), 7 had stable disease (SD), and 10 experienced progressive disease (PD). According to ARMS results, the mean mutant content was 86.1% (247/287) in the PR group, 48.7% (110/226) in the SD group, and 6.0% (19/317) in the PD group, and with a significant difference (P = 0.001). We divided 26 patients into three subgroups according to EGFR mutation heterogeneous status, which were “pure wild type EGFR”, “EGFR mutation with heterogeneity” and “pure mutated EGFR”. The PFS were 3.01 months (95% CI 0.51–5.52), 11.35 months (95%CI 6.37–15.21) and 16.21 months (95%CI 8.21–25.19) for the three groups, respectively (P = 0.001).
Mol Ther Nucleic Acids. 2014 Aug; 3(8): e186
Coexpression of HBV-specific gRNAs and Cas9 suppressed the production of HBV proteins in vitro To construct HBV-specific gRNAs, we searched for a potential 20-base target sequence on the genome of the genotype A HBV-expression vector pAAV/HBV1.2 with the initiating 5′G and the 3′-downstream PAM (GN19-NGG). A 5′G is required for transcription from the U6 promoter in the gRNA-expression cassette. Coexpression of HBV-specific gRNAs and Cas9 suppressed the production of HBV proteins in vitroWe designed a panel of eight HBV-specific gRNAs targeting different regions of the HBV genome (Figure 1a). The sequences and locations of these HBV-specific gRNAs are detailed in Table 1. To examine the efficiency of each individual gRNA in suppressing HBV protein expression, we cotransfected the HBV-, individual gRNA-, and Cas9-expression vectors to Huh7 cells. By measuring the intracellular core (HBcAg) and surface antigen (HBsAg) expression levels, we found that the gRNAs P1, S1, PS2, and PS3 exhibited higher efficacy in suppressing the expression of HBV proteins by 70, 40, 30, and 20%, respectively (Figure 2a). To improve the efficiency of the CRISPR/Cas9 system, we further constructed a dual expression vector containing both the gRNA- and Cas9-expression cassettes. We chose the gRNAs P1, S1, and PS2 because of their higher suppressive ability. The gRNA XCp was also chosen because its target sequence is highly conserved in the HBV genomes of genotypes A, B, and C. Interestingly, all four dual expression vectors with the gRNAs P1, S1, XCp, and PS2 significantly suppressed the intracellular expression of surface proteins by 96, 90, 82, and 77%, respectively (Figure 2b). We also measured the HBsAg levels in the culture supernatant. The gRNAs P1, XCp, and PS2 suppressed the HBsAg levels by 64, 36, and 16%, respectively (Figure 2c). Surprisingly, although the gRNA S1 significantly suppressed the expression of intracellular HBsAg and HBcAg, it failed to reduce the extracellular HBsAg levels.
Mol Ther Nucleic Acids. 2014 Aug; 3(8): e186
Multiplex gRNAs exhibited stronger effects on suppressing the expression of HBV proteins The CRISPR/Cas9 system has been used for multiplex genome cleavage.20 To examine the efficiency of multiplex genome cleavage in our experimental system, Huh7 cells were cotransfected with HBV-expression vector and the two most effective dual expression vectors, gRNAs P1 and XCp, alone or in combination. The results demonstrated that the combinatorial gRNAs P1 and XCp were more effective in suppressing intracellular HBsAg production than either gRNA alone, although the effect is only marginally significant (P = 0.078 for combination versus P1 and P = 0.085 for combination versus XCp) (Figure 3). It is likely because gRNA P1 or XCp alone was able to mediate efficient genome cleavage, thus limiting additional gain in genome cleavage from the addition of a second gRNA. We also conducted a T7 endonuclease 1 (T7E1) assay to determine the percentage of insertion/deletion (Indel) resulting from repaired double-strand breaks introduced by the CRISPR/Cas9 system. The results indicated that the occurrence of mutated HBV expression templates edited by gRNAs P1 and XCp alone was 13.6 and 9.3%, respectively. Besides, the percentage of Indel mediated by combinatorial gRNAs P1 and XCp was 25.6%, which was higher than that mediated by P1 or XCp alone. Interestingly, we also observed a shorter band (~580 bp) in the PCR product directly amplified from cells treated with combinatorial gRNAs P1 and XCp (Supplementary Figure S2). By sequencing, the band proved to be the cleaved DNA segment mediated by gRNAs P1 and XCp (data not shown). This indicates that this combination could result in an efficient dual cleavage and removal of a larger DNA fragment.
Mol Ther Nucleic Acids. 2014 Aug; 3(8): e186
gRNA XCp targeting the conserved HBV sequence was effective for HBV genomes of different genotypes We also examined the effects of the conserved gRNA XCp on the HBV genomes of genotypes B and C. Our data demonstrated that gRNA-XCp/Cas9 was equally effective in suppressing the viral protein expression of all three genotypes of HBV. In contrast, the most effective gRNA P1 against genotype A of HBV did not significantly suppress the viral protein expression of genotype B, although it significantly suppressed that of genotype C (Figure 4a). Nevertheless, the suppressive effect of gRNA P1 on viral protein expression of genotype C is much less than that of gRNA XCp (P < 0.05), whereas both gRNAs exhibited a similar inhibitory effect on genotype A. Analysis of the target sequences of gRNA P1 in the HBV genomes of these three genotypes revealed that the HBV genomes of genotypes B and C had a single-nucleotide polymorphism in the PAM, although they had the perfectly matched 20-bp target sequence (Figure 4b). In contrast, the target sequence and PAM of gRNA XCp are exactly the same in all three genotypes (Figure 4c). This result indicates the importance of PAM for genome cleavage by the CRISPR/Cas9 system, and also provides further evidence that the effects of gRNAs P1 and XCp are mediated by the CRISPR/Cas9 system.
Rab3D is necessary for tumor metastasis and progressionin vivoTo further test the significance of Rab3D in tumor progression, we next investigated the function of Rab3D in tumor metastasis and progressionin vivo. At first, we established the cancer cell lines stably overexpressing recombinant human Rab3D (Fig. 6Aand Fig. S4A) and stably transfecting with GFP-Rab3D shRNA, respectively (Fig. 6Band Fig. S4B). We injected these cells separately into mammary fat pads of nude mice to establish spontaneous metastasis model and monitored tumor growth and metastasis. Clear boarders without obvious invasion to surrounding tissues were observed in the control group, while tumors formed by Rab3D-MCF-7 cells invaded surrounding muscles, mammary fat pads as well as lung tissues (Fig. 6Cand Fig. S4C), demonstrating that Rab3D-MCF-7 cells became more invasive. In the metastatic lung, we observed small metastatic clones with GFP density near the blood vessels in the Rab3D-MCF-7 group. Conversely, stable knockdown of Rab3D in xenograft tumor model is sufficient to reduce metastatic colonies in the lung (Fig. 6Dand Fig. S4D). In addition, there were no obvious differences of cell proliferationin vitro(Fig. S5A and S5B) and tumor growthin vivo(Fig. S5C-F) among different groups, although the overexpression of Rab3D decreased apoptosis to some extent (Fig. S5G), demonstrating that Rab3D is highly specific for promoting tumor invasion and metastasis but not due to changes in proliferation.Consistent with our observationsin vitro, the levels of Rab3D expression were positively correlated with the levels of N-cadherin, phosphorylated GSK3β, snail, but negatively correlated with E-cadherinin vivoby IHC analysis (Fig. 6Eand Fig. S6A-E). These data have further emphasized the positive correlation between Rab3D and EMT.Fig. 6Falso showed that the level of plasma Hsp90α in Rab3D-MCF-7 xenografts was twice as much as that in the control group (n=5). Furthermore, stable Rab3D knockdown in the xenografts showed much lower level of Hsp90α in blood plasma compared with controls. Taken together, our results support that Rab3D is necessary and sufficient to promote tumor metastasis. A working model for the effect of Rab3D on metastasis is shown inFig. 6G.Figure 6:In vivoeffects of Rab3D on tumor metastasis.(A-B). Rab3D expression in stably transfected tumor cell lines. (C). Representative images of primary tumors and lung section stained with hematoxilin and eosin in control and Rab3D-MCF-7 xenografts bearing mice (n = 5 mice per group). (D). H & E staining of lung in control and shRab3D-MDA-MB-231 xenografts bearing mice. (E). Immunohistochemical staining images and quantification of EMT-related signaling activation in control and Rab3D-MCF-7 xenografts. Scale bar, 50μm. (F). The level of plasma Hsp90α in nude mice detected by ELISA assay (n = 5 mice per group). (G). The working model for Rab3D-induced tumor cell invasion. In response to hypoxia, intracellular Rab3D is increased and its expression is correlated with tumor malignancy. Rab3D regulates exosomes release and Hsp90α secretion, which promotes EMT and tumor metastasis. eHsp90α indicates extracellular Hsp90α.
The overall patients’ characteristics are comparable between the original and the external cohort in terms of age, pathologic T stage, N stage and ISUP grade训练集和验证集之间具有可比性
Front Oncol. 2021; 11: 698607
Assessment of Publication Bias
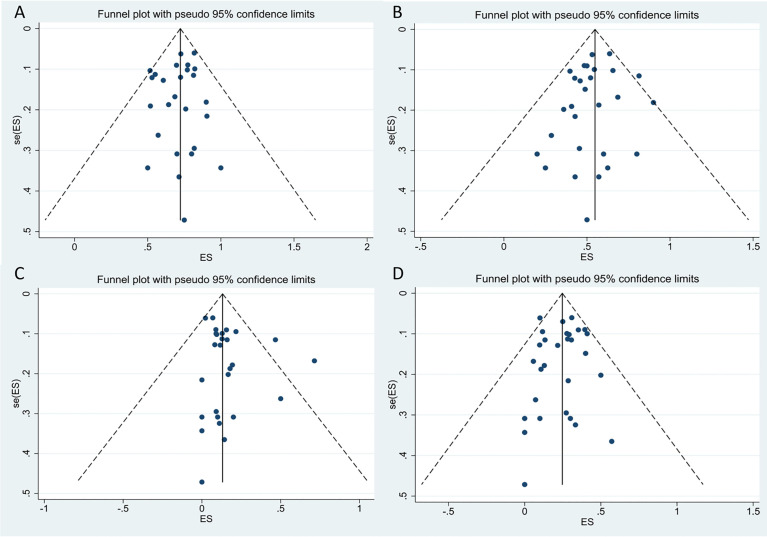
We performed a funnel-plot analysis for the ORR, CRR, and rates of severe CRS and ICANS of all studies, which showed good symmetry (Figure9). Egger’s and Begg’s tests were also performed, and all P-values obtained were greater than 0.5 (Table4), suggesting absence of significant publication bias.
 Open in a separate window
Figure9
The funnel plots for included studies.(A)The funnel plot of total overall response rate.(B)The funnel plot of total complete response rate.(C)The funnel plot of total cytokine release syndrome rate.(D)The funnel plot of total immune effector cell-associated neurotoxicity syndrome rate.
Table4
Begg’s and Egger’s tests of ORR, CRR, CRS and ICANS in all included studies.
ORR
CRR
CRS
ICAMS
Begg’s test
0.693
0.721
0.593
0.441
Egger’s test
0.437
0.290
0.151
0.713
ORR, overall response rate; CRR, complete response rate; CRS, cytokine release syndrome; ICANS, immune effector cell-associated neurotoxicity syndrome.
Sensitivity Analysis
We used random-effects model and fixed-effects model to analyze the stability of the results in all analysis, and the two results showed a good stability in all cohorts. In the cohort with more than 75% heterogeneity, we performed subgroup analysis based on the possible causes of heterogeneity, which had been shown in theResultssection.
Real-World Performance of the Products
A real-world study involving 122 patients with DLBCL as the main tumor type along with tFL, HGBCL, and PMBCL observed that axi-cel had comparable overall efficacy and safety between clinical and trial settings (ORR: 70vs.68%, P = 0.25; CRR: 63vs.42%, P = 0.016; severe CRS rate: 15vs.16%; P = 0.83; severe ICANS rate: 35vs.36%; P = 0.81) in ZUMA-1 eligible and ineligible groups, respectively, although the CRR and duration of response were more favorable in patients of ZUMA-1 eligible group (40). In addition, another real-world study including 298 patients undergoing standard-of-care axi-cel treatment showed consistent results (ORR: not provided; CRR: 69vs.56%, P = 0.02; severe CRS rate: 5vs.10%; P = 0.10; severe ICANS rate: 28vs.36%; P = 0.18) in patients withoutvs.with comorbidities indicated in ZUMA-1 exclusion criteria, respectively, while the latter had shorter progression-free survival (PFS) and overall survival (OS) (28).
Of note, regarding the concerns for the inconsistency of bridging therapy in the pivotal trials, there have been two studies reported on axi-cel and one study on both axi-cel and tisa-cel that evaluated the impact of bridging therapy on the efficacy and safety of patients with R/R LBCL. Although bridging therapy is needed in patients who tended to have a higher tumor burden, the results were not significantly different between the patients with bridging therapy and non-bridging therapy; radiation therapy had been safely administered as a bridging therapy and resulted in a superior efficacy outcome (27,36,39).
In addition, a study which included patients with DLBCL involving CNS disease, HIV, and active HBV also provided the evidence of efficacy and safety of axi-cel in the real-world setting since these patients with severe comorbidities were excluded from the pivotal clinical trial (31). Another study that included eight patients with secondary CNS involvement LBCL receiving tisa-cel did not report severe ICANS; the findings are suggestive of potential of CAR T-cell product treatment for the patients with CNS involvement (35).
Subgroup Analysis Based on the Type of Tumor
Since many of the included studies simultaneously reported more than one tumor type as listed inTable2, therefore, we divided them into different groups based on the type of tumor for analysis. For studies that did not report efficacy and safety results by type of tumor, we grouped them by their major tumor type (19,26,27,43–47,50). Case series that involved fewer thanfour patients after regrouping were excluded from analysis (Table3).
Table3
The results of performed meta-analysis in subgroups of product and tumor.
Subgroup
ORR, (95% CI)
CRR, (95% CI)
tisa-cel
axi-cel
liso-cel
Overall
tisa-cel
axi-cel
liso-cel
Overall
All patients
69% (.58–.79)
77%(.71–.82)
73%(.67–.78)
73%(.68–.77)
57%(.41–.72)
52% (.46–.58)
53%(.47–.59)
54%(.48–.59)
DLBCL
53%(.44–.61)
75%(.67–.83)
72%(.65–.78)
70%(.63–.76)
40%(.32–.49)
52% (.44–.60)
52%(.45–.59)
50%(.45–.56)
FL/tFL
86% (.64–1.00)
81%(.69–.90)
NA
83%(.73–.92)
73%(.48–.93)
64% (.54–.74)
NA
66%(.56–.76)
ALL
81% (.69–.90)
NA
NA
81% (.69–.90)
81% (.69–.90)
NA
NA
81% (.69–.90)
Subgroup
CRS, (95% CI)
ICANS, (95% CI)
tisa-cel
axi-cel
liso-cel
Overall
tisa-cel
axi-cel
liso-cel
Overall
All patients
21%(.07–.38)
9%(.07–.12)
2%(.01–.05)
13%(.09–.19)
8%(.05–.12)
31% (.27–.35)
10%(.07–.14)
22%(.17–.27)
DLBCL
8%(.01–.21)
8%(.05–.12)
NA
9%(.07–.13)
8%(.03–.13)
32% (.26–.38)
NA
25%(.19–.31)
FL/tFL
NA
2%(.00–.08)
NA
2%(.00–.08)
NA
31%(.18–.46)
NA
31%(.18–.46)
ALL
55% (.45–.64)
NA
NA
55%(.45–.64)
11% (.05–.17)
NA
NA
11% (.05–.17)
Open in a separate window
ORR, overall response rate; CRR, complete response rate; CRS, cytokine release syndrome; ICANS, immune effector cell-associated neurotoxicity syndrome; DLBCL, diffuse large B cell lymphoma; FL/tFL, follicular lymphoma or transformed follicular lymphoma; ALL, acute lymphoblastic leukemia; NA, not applicable.
Diffuse Large B Cell Lymphoma
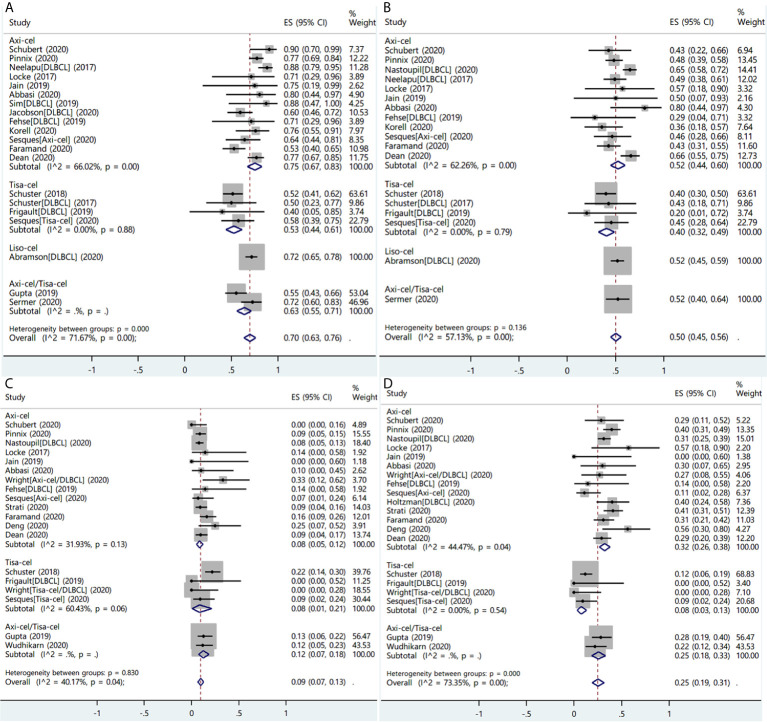
A total of 26 studies reported the efficacy and/or safety of the three products in the treatment of DLBCL (16,17,19,22,23,26–31,34–36,38–47,49,50). The ORR of the three products for DLBCL was 70% (95% CI: 0.63–0.76; I2= 71.7%, P < 0.01), and response rate was 75% (95% CI: 0.67–0.83; I2= 66.0%, P < 0.01), 53% (95% CI: 0.44–0.61; I2= 0.0%, P = 0.88), and 72% (95% CI: 0.65–0.78) in axi-cel, tisa-cel, and liso-cel groups, respectively (Figure6A). The CRR was 50% (95% CI: 0.45–0.56; I2= 57.1%, P < 0.01) in all patients, whereas individual complete response rate was 52% (95% CI: 0.44–0.60; I2= 62.3%, P < 0.01), 40% (95% CI: 0.32–0.49; I2= 0.00%, P = 0.79), and 52% (95% CI: 0.45–0.59) in axi-cel, tisa-cel, and liso-cel groups, respectively (Figure6B).
 Open in a separate window
Figure6
The forest plots of pooled results in patients with diffuse large B-cell lymphoma.(A)The forest plot of overall response rate of each product.(B)The forest plot of complete response rate of each product.(C)The forest plot of severe cytokine release syndrome rate of each product.(D)The forest plot of severe immune effector cell-associated neurotoxicity syndrome rate of each product.
The proportion of patients with severe CRS among all was 9% (95% CI: 0.07–0.13; I2= 40.2%, P = 0.04), and the respective rates of severe CRS for the patients with axi-cel and tisa-cel were 8% (95% CI: 0.05–0.12; I2= 31.9%, P = 0.13) and 8% (95% CI: 0.01–0.21; I2= 60.4%, P = 0.06) (Figure6C). The study on liso-cel did not report the safety outcomes according to disease type.
Subgroup analysis was performed in tisa-cel group according to whether the Penn scale was used; the findings revealed that rates of severe CRS were 18% (95% CI: 0.11–0.26; I2= 0.0%) in the group using the Penn scale and 5% (95% CI: 0.00–0.17; I2= 0.0%) in the group using non-Penn scale (Figure S3).
The proportion of patients with severe ICANS among all was 25% (95% CI: 0.19–0.31; I2= 73.4%, P < 0.01), and the respective ICANS rates for the patients with axi-cel and tisa-cel were 32% (95% CI: 0.26–0.38; I2= 44.5%, P = 0.04) and 8% (95% CI: 0.03–0.13; I2= 0.0%, P = 0.54) (Figure6D).
Follicular Lymphoma or Transformed Follicular Lymphoma
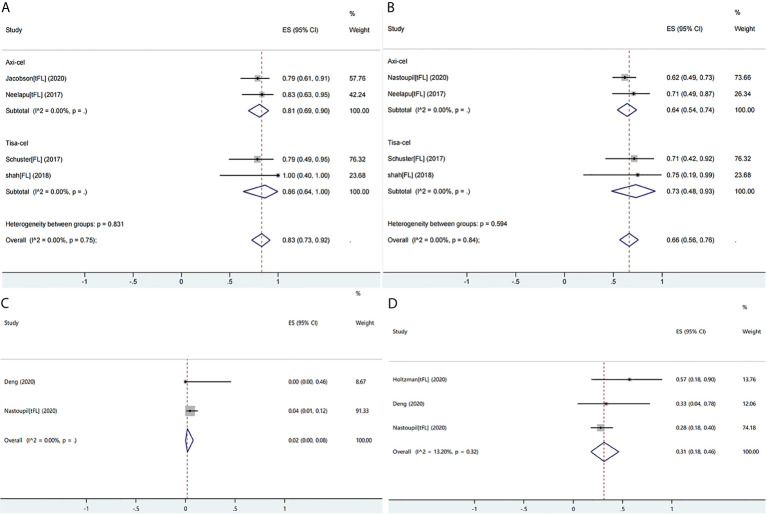
Ten studies reported the efficacy or safety of the three products in the treatment of FL/tFL (16,19,28,34,36,38–40,45,49). The ORR of the patients with FL/tFL was 83% (95% CI: 0.73–0.92; I2= 0.0%, P = 0.75) and CRRs of the patients undergoing treatment with axi-cel and tisa-cel were 81% (95% CI: 0.69–0.90 I2= 0.0%) and 86% (95% CI: 0.64–1.00 I2= 0.0%), respectively (Figure7A). The CRR of the patients with FL/tFL was 66% (95% CI: 0.56–0.76; I2= 0.0%, P= 0.84), and CRRs of the patients undergoing treatment with axi-cel and tisa-cel were 64% (95% CI: 0.54–0.74; I2= 0.0%) and 73% (95% CI: 0.48–0.93, I2= 0.0%), respectively (Figure7B). The study on liso-cel included three patients with grade 3B FL, two patients among them achieved CR and maintained it for more than one year, but the study did not report the safety events.
 Open in a separate window
Figure7
The forest plots of pooled results in patients with follicular lymphoma or transformed follicular lymphoma.(A)The forest plot of overall response rate of each product.(B)The forest plot of complete response rate of each product.(C)The forest plot of severe cytokine release syndrome rate of axi-cel.(D)The forest plot of severe immune effector cell-associated neurotoxicity syndrome rate of axi-cel.
Three studies on axi-celthat reported ICANS or CRS events were eligible for meta-analysis, and the rates of severe CRS and ICANS were 2% (95% CI: 0.00–0.08; I2= 0.0%) and 31% (95% CI: 0.18–0.46; I2= 13.2%, P = 0.32), respectively (Figures7C, D). The severe ICANS rate in patients with tisa-cel was also acceptable, and no associated death was reported, but the available data did not support a meta-analysis.
Meta-Analysis of Overall Efficacy of the CAR-T Cell Products
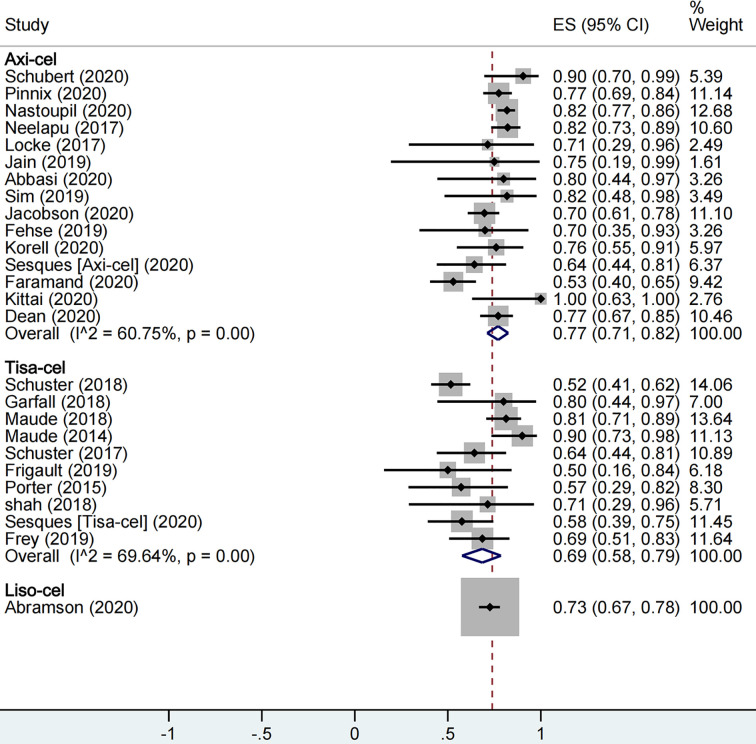
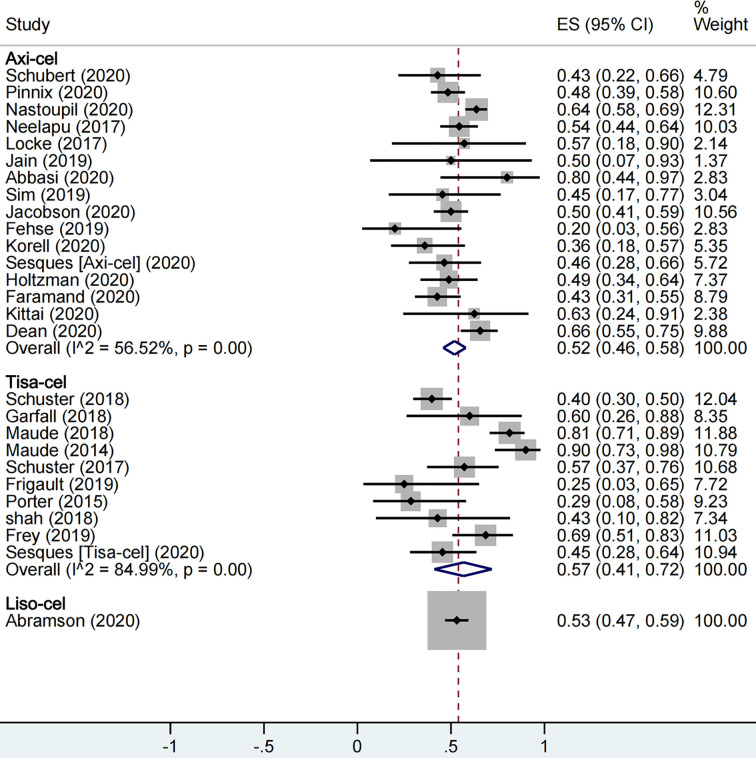
A total of 1,673 patients were included for ORR evaluation. ORR was calculated as 73% (95% CI: 0.68–0.77; I2= 70.9%, P < 0.01) for all patients, and axi-cel, tisa-cel, and liso-cel groups showed individual response rates of 77% (95% CI: 0.71–0.82; I2= 60.8%, P < 0.01), 69% (95% CI: 0.58–0.79; I2= 69.6%, P < 0.01), and 73% (95% CI: 0.67–0.78), respectively (Figure2). A total of 1,640 patients were included for CRR evaluation. CRR was calculated as 54% (95% CI: 0.48–0.59; I2= 73.0%, P < 0.01) for all patients, and it was estimated as 52% (95% CI: 0.46–0.58; I2= 56.5%, P < 0.01), 57% (95% CI: 0.41–0.72; I2= 85.0%, P < 0.01), and 53% (95% CI: 0.47–0.59) in axi-cel, tisa-cel, and liso-cel groups, respectively (Figure3).
 Open in a separate window
Figure2
The forest plot of total overall response rate of each product.
 Open in a separate window
Figure3
The forest plot of total complete response rate of each product.
Among all, tisa-cel group showed significant heterogeneity. Therefore, we divided the group into lymphoma group and ALL group for subgroup analysis considering that the indications of tisa-cel included lymphoma and ALL. The respective ORR and CRR were estimated as 57% (95% CI: 0.50–0.65; I2= 0.0%, P = 0.50) and 44% (95% CI: 0.36–0.52; I2= 0.0%, P = 0.47) in the lymphoma group, whereas CRR was estimated as 81% (95% CI: 0.69–0.90; I2= 55.7%, P = 0.10) in ALL group, suggesting this indication as the source of heterogeneity in tisa-cel study group.
Meta-Analysis of Overall Safety of the CAR-T Cell Products
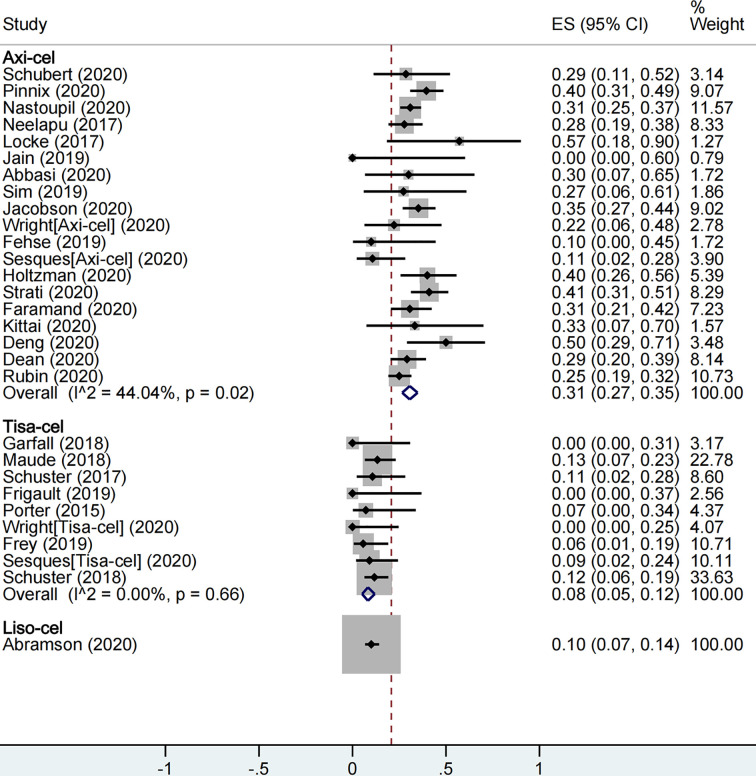
With respect to safety, a total of 1,860 patients were included for CRS rate evaluation. The proportion of patients with severe CRS among all patients was 13% (95% CI: 0.09–0.19; I2= 86.7%, P < 0.01), and the proportion was 9% (95% CI: 0.07–0.12; I2= 34.7%, P = 0.08), 21% (95% CI: 0.07–0.38; I2= 89.3%, P < 0.01), and 2% (95% CI: 0.01–0.05) in axi-cel, tisa-cel, and liso-cel groups, respectively (Figure4). It could be observed that the tisa-cel group showed significant heterogeneity.
 Open in a separate window
Figure4
The forest plot of total severe cytokine release syndrome rate of each product.
Previous studies have shown that the Penn scale tends to upgrade toxicity relative to other systems (52–54); thus, we conducted a subgroup analysis based on whether the Penn scale was used considering that majority of tisa-cel studies used the Penn scale. The proportion of patients with severe CRS in tisa-cel group with Penn scale and non-Penn scale were 32% (95% CI: 0.14–0.53; I2= 90.3%, P < 0.01) and 4% (95% CI: 0.00–0.13; I2= 0.0%, P = 0.51), and significant heterogeneity still appeared in groups using the Penn scale (Figure S1). Furthermore, we observed that groups using the Penn scale included all ALL studies and part of lymphoma studies; accordingly, we conducted a further subgroup analysis and observed that severe CRS rate was 55% (95% CI: 0.45–0.64; I2= 0.0%) in the ALL group and 19% (95% CI: 0.06–0.36; I2= 74.9%, P = 0.01) in the lymphoma group (Figure S2).
A total of 2,079 patients were included for ICANS evaluation. The overall proportion of patients with severe ICANS among all was 22% (95% CI: 0.17–0.27; I2= 81.9%, P < 0.01), and the proportion was 31% (95% CI: 0.27–0.35; I2= 44.0%, P = 0.02), 8% (95% CI: 0.05–0.12; I2= 0.0%, P = 0.66), and 10% (95% CI: 0.07–0.14) in axi-cel, tisa-cel, and liso-cel groups, respectively (Figure5).
 Open in a separate window
Figure5
The forest plot of total severe immune effector cell-associated neurotoxicity syndrome rate of each product.
Front Oncol. 2021; 11: 698607.
Study Characteristics
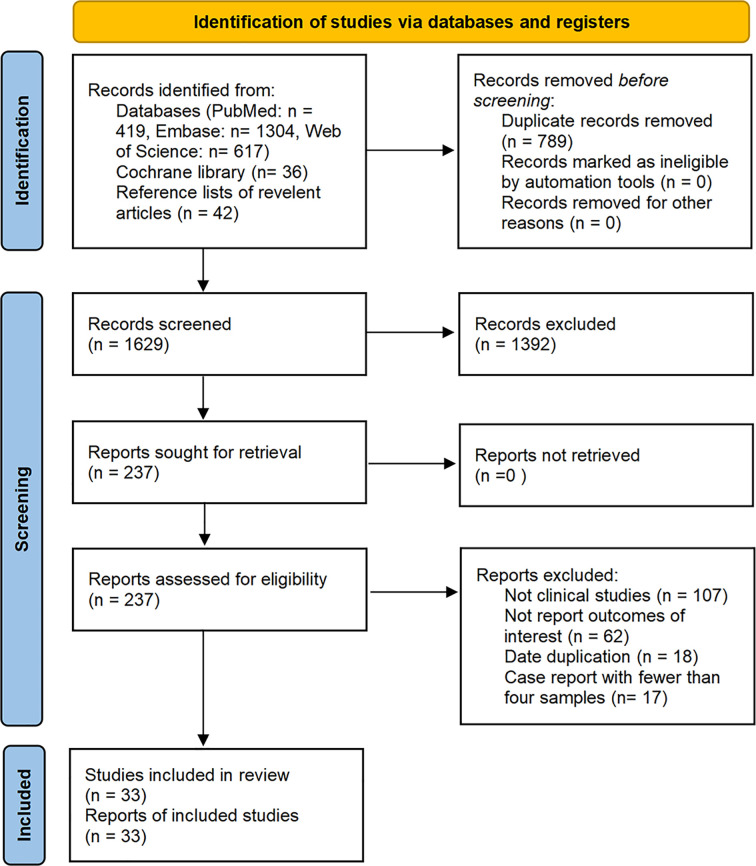
The database search resulted in identification of a total of 2,418 articles published on studies related to the treatment of malignant tumors with axi-cel, tisa-cel, or liso-cel, of which 33 studies met our eligibility criteria and were included in the analysis after de-duplication and screening title, abstract, and full-text. These studies included eighteen axi-cel, nine tisa-cel, one liso-cel, and five studies with both axi-cel and tisa-cel (Figure1).
 Open in a separate window
Figure1
Flow diagram of the study select process.
A total of 2,172 patients were analyzed from the selected studies, including 1,352 (62.2%) patients with DLBCL, 192 (8.8%) patients with follicular lymphoma (FL) or transformed follicular lymphoma (tFL), 95 (4.3%) patients with primary mediastinal B-cell lymphoma (PMBCL), 70 (3.2%) patients with high-grade B cell lymphoma (HGBCL), 140 (6.4%) patients with acute lymphoblastic leukemia (ALL), 14 (0.6%) patients with chronic lymphocytic leukemia (CLL), 10 (0.5%) patients with multiple myeloma (MM), 6 patients with transformed marginal zone lymphoma (TMZL), 11 patients with Richter’s syndrome (RS), and 282 (13.0%) patients with unidentified tumor types. Among all patients, 1,718 (79.1%) were evaluated for response, 1,860 (85.6%) were evaluated for cytokine release syndrome (CRS), and 2,079 (95.7%) were evaluated for ICANS.
There were 14 studies with median age of the patients <60 years, 15 studies with median age ≥60 years, 1 study with mean age ≥60, and 3 studies did not report age of the patients. The studies by Sermer etal. and Wudhikarn etal. included patients treated in the same institution for a similar period, so the data of the patient had a large overlap; however, Sermer etal. reported only efficacy data, while Wudhikarn etal. reported only adverse effects, so data synthesis was not affected (22,23). Moreover, the studies by Frey etal. (30 samples) and by Maude etal. (35 samples) included five patients with ALL from the same trial (ClinicalTrials.gov number:NCT02030847); however, considering the proportion of overlapping patients was small, no study was omitted (24,25). Sensitivity analysis was performed to test for stability in subgroup analysis of patients with ALL. Notably, all patients included in the pooled analysis actually received CAR-T cell infusion, and those patients were excluded who were intent to receive CAR-T cell administration but finally discontinued. The detailed characteristics of the included studies are shown inTable2.


